Outline of this program
- This is a program for curve fitting by Simplex method.
- Although you need to change the equation (function) for curve fitting on source code one by one, this is a very powerful tool. Because a possibility of wrong fitting is low if proper initial values are given.
- When you have no idea about initial values, you can set all initial values to 1.0.
- In addition, in order to confirm a fitting result immediately, the drawing routine by gnuplot is added in this program. So, it is required for a data input file to be included some information for drawing.
- In this example, following functions are used.
Sample (1)
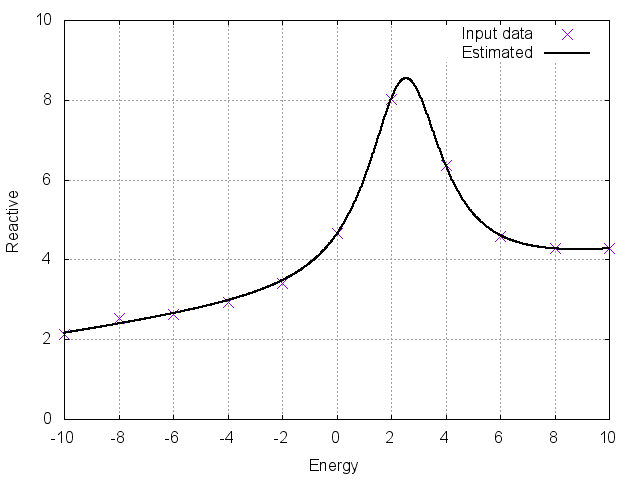
!Lorentz type+linear curve (mpara=5)   input file: inp_simp_0.csv
Vfunc=param(2)*param(1)**2.0D0/((x-param(0))**2.0D0+param(1)**2.0D0)+param(3)+param(4)*x
Sample (2)
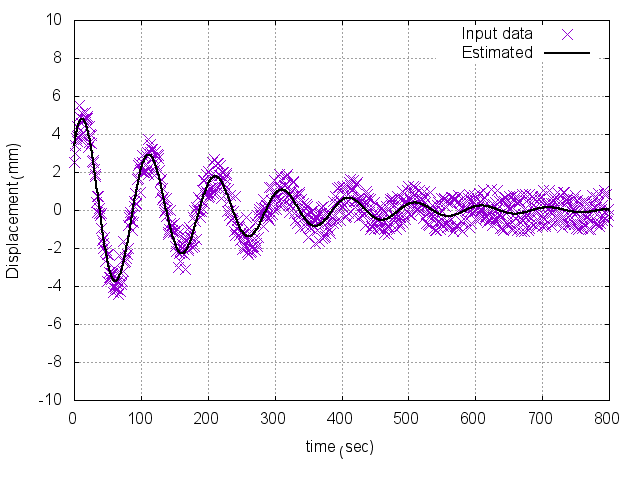
!Damped oscillation (mpara=4)   input file: inp_simp_1.csv
Vfunc=param(0)*exp(-param(1)*x)*sin(param(2)*x+param(3))
Format of input data file
 001 | Simplex_test_1
 002 | time_(sec),Displacement_(mm)
 003 | N,0,800,100,"%.0f"
 004 | N,-10,10,2,"%.0f"
 005 | 800
 006 | 0.000,2.543
 007 | 1.000,3.402
 008 | 2.000,2.978
..........
- 001
- Comment
- 002
- x-axis label, y-axis label
- 003
- Type of x-axis (N: normal, L: log), x-min.value, x-max.value, x-increment, x-format (style of x-axis)
- 004
- Type of y-axis (N: normal, L: log), y-min.value, y-max.value, y-increment, y-format (style of y-axis)
- 005
- Number of input data sets
- 006
- (Lower rows are x and y-values of data)
Batch command for execution
For execution of this program 'f90_simplex', (1) input filename, (2) output filename, (3) image output filename for gnuplot and (4) initial values of unknown parameters for Simplex method must be inputted from command line.
gfortran -o f90_simplex f90_simplex.f90
./f90_simplex inp_simp_0.txt out_simp_0.txt fig_simp_0.png 1 1 1 1 1